
Research – Straight Talk From Americans – 2000
A Survey for the Pew Center for Civic Journalism
Conducted By Princeton Survey Research Associates
The San Francisco Area: Part One
CONTENTS
Highlights
This Survey
The State of Local Community
Top Local Problems
Table 1: Most Important Local Issue
Detailed Findings: Growth, Traffic and Sprawl
The Daily Grind
Table 2: Top Most Ignored Local Issues
Detailed Findings: Poverty, Hunger and Homelessness
Detailed Findings: Crime and Safety
Table 3: Feeling Safe
Detailed Findings: Race
Immigration
Differing Perspectives
Table 4: Agree That Institutions Are Fair
Neighborhood Diversity
[To San Francisco Part Two >>]
San Francisco Bay Area residents enter the new century happy with their community in many ways, but deeply troubled by the problems of growth, sprawl and traffic that loom over the future of the area. A remarkable 47 percent of the public cites sprawl as the top concern in the area.
The issues of poverty, hunger and homelessness are No. 2 on the Bay Area’s list of most important local problems, with 14 percent naming this as the top issue. This finding may surprise those whose perception of the Bay area is focused on Silicon Valley and the huge wealth spun off by the Internet and other high-technology businesses. This level of concern is far greater than that found across the country generally.
In this racially diverse community, there are sharp divisions on some issues among various groups, particularly on the fairness of local institutions. But there is agreement across racial groups that racial tension is not a major problem in the area.
The poll highlights a number of additional areas where San Francisco residents are concerned and often divided about problems and solutions.
- White residents and minority residents have sharply different views on whether local institutions treat minorities fairly. For example, a majority of white and Asian-American residents say the police treat everyone equally, while only about a third of African-American and Hispanic residents agree.
- In addition, attitudes in the Bay area are more critical of the police and local government than elsewhere. The judgments that the police are fair and that the local government is fair are the lowest in any of the four cities surveyed.
- Residents are equally divided on whether recent immigrants from other countries have caused more problems in the United States or whether they have made contributions. About a third take each view.
- San Francisco residents see problems in their local public schools and identified changes that need to be made. Sixty-three percent say the quality of the education offered in the local public schools is a problem. And half say updated educational resources are a great need in the public schools.
- While most residents express satisfaction with how much time they spend in every day tasks, parents with children at home and those from households where both the husband and wife work are less satisfied with their leisure time. (See Detailed Findings: Personal Life) It is important to remember that dual-income households does not mean high-income households: thirty-five percent of these households in San Francisco report incomes of less than $60,000 a year even with at least two incomes.
This Survey
This survey is one of five designed to provide journalists a clear look at where the nation and its communities stand at the start of a new century. This survey of the San Francisco area – accompanied by a national poll and surveys in Tampa, Denver and Philadelphia – serves as a guide to areas worthy of further investigation and reporting and as a context for that investigation and reporting. In addition to the broad look at the state of the nation and the communities, the survey takes a closer look at public opinion in three specific problem areas: growth and sprawl, race, and education. These areas were identified by PCCJ as of particular importance in shaping the journalism of the years ahead.
This poll for the Pew Center for Civic Journalism offered San Francisco area residents the opportunity to list the issues most important to them, both at the national and local levels. A series of open-ended questions elicited free-form responses from the public about what is on their minds at the end of the decade. This approach allowed citizens to express their views without the filter of defining the problems to be discussed. After these free-form questions, more specific questions were included to focus on specific issues.
These are among the findings of a new survey in the San Francisco area about the state of the country and our local communities at the end of the 1990s. This survey of adults aged 18 and older in the San Francisco area was conducted on behalf of the Pew Center for Civic Journalism, an initiative of the Pew Charitable Trusts. This survey covered residents in Alameda, Contra Costa, Marin, San Francisco, Santa Clara and San Mateo counties in the San Francisco Bay area. All the findings of the survey refer to that six-county area. A representative sample of 500 adults was interviewed by telephone during the period October 29 through November 30, 1999. For results based on the total sample, one can say with 95 percent confidence that the error attributable to sampling is plus or minus five percentage points. Results based on smaller subgroups are subject to a larger margin of sampling error. In addition to sampling error, the practical difficulties of conducting telephone surveys can introduce error or bias into their results.
San Francisco residents are happy with their community overall, although they are less enthusiastic than most Americans about where they live. Just under two-thirds (62%) say they are satisfied with “the way things are going in the San Francisco area.” Thirty-three percent are dissatisfied and five percent are not sure. These numbers are strong, but they are below the figures from the national PCCJ survey. Nationally, 74 percent of Americans say they are satisfied with “the way things are going in your community.” Only 22 percent are dissatisfied.
Asked to use another yardstick, three-quarters of residents (77%) rate the San Francisco Bay area positively as a place to live (The survey is based on telephone interviews with residents of Alameda, Contra Costa, San Francisco, Marin, Santa Clara and San Mateo counties in the San Francisco area. All references to San Francisco, the San Francisco area, the San Francisco Bay area and the like refer to the six-county area). That includes 37 percent who rate the area as excellent and 40 percent who rate it as good. Just 22 percent rate their community negatively, with 16 percent rating their community as only fair and 6 percent rating it as poor. Two percent do not answer. Again, these numbers are positive, but a bit below the national figures. Nationally, 84 percent of the public give their community positive ratings and 16 percent negative ratings.
Within these overall feelings of satisfaction, there are variations by gender, age and income.
- Men are more likely to say they are satisfied with the area than women (68% vs. 56%). (Differences in survey findings are noted in this report only if they meet the criterion of statistical significance at the (95%) level of confidence.)
- Younger adults (those under age 35) are more satisfied, with 74 percent expressing that view, compared with 56% of older residents.
- Those with incomes of at least $60,000 a year are the most satisfied, with 72 percent saying they are satisfied, compared with 56 percent of those in lower-income groups.
- Those who say they live in the suburbs are the most satisfied, with 71 percent taking that view. Fifty-eight percent of those who say they live in a big city are satisfied.
- There are few significant differences by race in levels of satisfaction with the area. Only African-American residents express less satisfaction, although the small number of interviews with this group weakens the certainty of such a conclusion.
- In contrast, there are differences by race when one looks at the ratings of the area, as opposed to levels of satisfaction. Eighty-two percent of the white residents rate the area positively, but only 66 percent of the Hispanic residents, 59 percent of the Asian-American residents and 63 percent of the African-American residents do so.
Top Local Problems
![]()
“Growth and traffic. It has become a major thing… The growth has gotten out of hand.”
— Words from one San Francisco resident
![]()
San Francisco area residents are remarkably united about the biggest local problem – sprawl, growth and traffic. Nearly half of the public (47%) names this as the top local issue without prompting. (See Table 1.) And every major demographic group save one makes this far and away the most important problem. (African-American residents put three issues tied at the top of their most important problem list: name sprawl, crime and violence, and poverty and hunger.)
|
Now, what do you think is the most important problem facing the San Francisco area? |
San Francisco |
Nation |
||
|
Development/Sprawl/Traffic/Roads |
47% |
18% |
||
|
Poverty/Hunger/Homelessness |
14% |
1% |
||
|
Crime/violence |
10% |
18% |
||
|
Economic issues/The economy |
9% |
13% |
||
|
Education |
5% |
10% |
||
|
The Environment |
2% |
2% |
||
|
Child and teen issues |
1% |
6% |
||
|
Problems with Politics/Politicians |
1% |
3% |
||
|
Moral decline/Decline of Family Values |
1% |
3% |
||
|
Problems with Immigrants |
1% |
2% |
||
|
Things are good here |
* |
3% |
||
|
Racism/Discrimination/Intolerance |
* |
2% |
||
|
Health/medicine |
* |
1% |
||
|
Natural disasters/Hurricanes/Floods |
* |
1% |
||
|
Law enforcement/Justice/Court system |
0% |
2% |
||
|
Senior citizen issues/Care of the elderly |
0% |
1% |
||
|
Other |
3% |
4% |
||
|
New to the area/Just moved here |
* |
1% |
||
|
Nothing/no problems/None |
2% |
6% |
||
|
Don’t know/Can’t think of anything |
4% |
5% |
||
|
Refused/No comment |
* |
1% |
||
NOTE: An asterisk (*) means less than .5 percent gave this answer.
The No. 2 problem in the area is poverty, hunger and homelessness, named by 14 percent of the residents. This is a remarkable finding in a time of substantial prosperity nationwide and in at least parts of the San Francisco Bay area. This challenges the common perception of the area as flush with the prosperity generated by Silicon Valley and the Internet revolution.
Crime is cited as the No. 3 problem from the San Francisco point of view, mentioned by just about one in ten residents (10%) as the top issue.
Issues related to sprawl are mentioned more often by the college-educated and higher-income residents.
- Fifty-two percent of those making $40,000 or more name it as a top issue, compared with 39 percent of those making less.
- College graduates are more likely to be concerned about sprawl than those who never attended college at all (53% vs. 40%).
- Asian-American residents (53%) and white residents (52%) are more likely to mention sprawl than African-American residents (21%).
- Interestingly, there are no differences in the judgment of sprawl as the top problem based on where one lives – big city, suburb or elsewhere – nor by how long a worker’s daily commute is.
Crime is more likely to be the top issue for those who have not been to college and for lower-income residents.
- Among those who make less than $20,000 a year, 21 percent mention crime as an issue, compared with only five percent of those who make $60,000 a year and more.
- Those who have not been to college mention crime as the top issue 19 percent of the time, compared to six percent of those who have gone to college.
- African-American residents name crime as the top issue 25 percent of the time, compared to eight percent for white residents.
- Those who live in a small city or town are the most likely to mention crime, with 20 percent doing so. Only nine percent of big city dwellers and five percent of suburbanites mention it.
Detailed Findings: Growth, Traffic and Sprawl
The San Francisco area has seen explosive growth over the past few decades, growth that has meant jobs, money and opportunity for the community and its residents. But this growth and development have had negative impacts as well, impacts that loom large as problems in the minds of many area residents.
The complex of issues surrounding growth, development, traffic and roads is easily the top issue on the list of problems that San Francisco residents mention without prompting, with 47 percent of them doing so.
This finding might even understate the level of concern about these problems. Asked in a specific question whether traffic congestion is a problem in the community where you live, a majority of San Francisco residents (68%) say it is a bigproblem. And 19 percent say it is a small problem. Only 12 percent say traffic congestion is not a problem where they live. The perception of traffic congestion as a problem is so strong that there are few differences among demographic groups in that judgment.
Likewise, a specific question about “too much growth and development” elicited the response that these issues are a bigproblem in the San Francisco area according to 46 percent of residents. Twenty-seven percent say it is a small problem and only 26 percent say it is not a problem.
- Fifty percent of the white residents and 47 percent of Asian-American residents say too much growth and development is a big problem, compared with only 23 percent of African-American residents.
- Those making $40,000 to under $60,000 are the most adamant that this is a big problem: 61 percent say so, compared with about four in ten in other income groups.
The Daily Grind
Traffic is perceived to be a problem in part because residents spend so much time in their cars. Nine out of ten San Francisco area workers (90%) commute to their jobs on an average day. For just a third of the workers (30%), the commute takes less than 15 minutes. And another third (31%), the daily commute lasts 15 minutes to just under half an hour. But for 29 percent of the workers, the travel to work lasts 30 minutes to just under an hour. And for eight percent of the workers, the commute is an hour or more each and every workday.
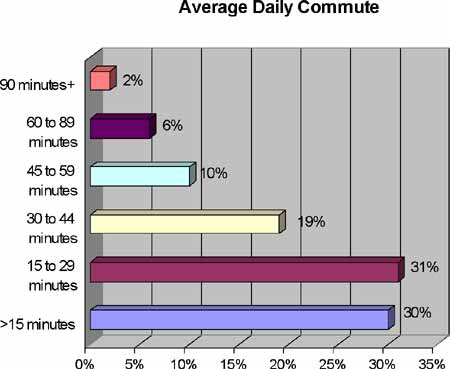
These figures are close to those from the national survey, although they indicate a somewhat longer commute in the Bay area – 37 percent of local residents spend a half hour or more each day getting to work, compared with 32 percent nationally.
In national terms, the average commute is getting longer. A 1993 survey for Family Circle magazine found 42 percent saying the daily commute was less than 15 minutes; 31 percent saying 15 to 29 minutes; 20 percent saying a half an hour to 59 minutes and five percent reporting an hour or more each day. (Telephone survey for Family Circle Family Index Project, based on 2,004 interviews of adult heads of households, June 1-June16, 1993 by Princeton Survey Research Associates.)
Those who say traffic congestion is at least a small problem were asked to pinpoint the cause of the problem. The answers reflect a lack of a consensus on the reasons, one stumbling block to solving the problem. Fifty percent say that the reason is simple population growth in the area. Seventeen percent blame a lack of adequate planning. Fourteen percent say not enough money has been spent on highways and transportation and 15 percent say over-development. Five percent are not sure. These figures are quite close to the analysis that Americans nationally give of the reason for traffic congestion in their communities.
The issues of growth and development are bedeviling local and state officials across the country as well as in San Francisco, in part because there is a substantial division of opinion over how to deal with the problems. This split is evident in the answers to a question about how local government should use its power to focus growth. Forty-three percent say that local government should allow growth and development to continue to occur in all areas. But 45 percent say that growth and development should be limited to areas that are already built up, implicitly protecting those areas that are not yet developed. Nationally, more Americans favor continued development (52%) than is true in San Francisco.
Thinking about the problems most ignored by local officials, San Francisco area residents put growth, development and roads at the top of the list. Twenty-two percent say this issue is being ignored. Slightly fewer residents say officials are ignoring problems related to crime and violence (4%) and to education (11%).
|
What problems in your local community, if any, don’t get enough attention from local government officials? |
San Francisco |
Nation |
||
|
Development/Sprawl/Traffic/Roads |
22% |
14% |
||
|
Poverty/Hunger/Homelessness |
17% |
2% |
||
|
Education |
11% |
6% |
||
|
Problems with Politics/Politicians |
5% |
4% |
||
|
Crime/violence |
4% |
10% |
||
|
Economic issues/The economy |
4% |
5% |
||
|
Child and Teen Issues |
2% |
4% |
||
Local newspapers and television stations have been devoting more and more stories to issues of sprawl, traffic and growth – and that effort has been noticed. Sixty percent of the San Francisco public gives their local news media excellent or good job marks for the job they do covering issues of growth, development and traffic. Twenty-seven percent give the local media “only fair” marks and 11 percent rate their work poor. Nationally, 58 percent of the public gives their local news media positive marks for covering the growth, development and traffic issues.
Detailed Findings: Poverty, Hunger and Homelessness
The perception of the San Francisco Bay area may be one that spotlights the incredible growth and wealth occurring in Silicon Valley with the Internet revolution, but local residents are remarkably focused on meeting basic human needs as the top local issue.
Poverty, hunger and homelessness rank second on the top local problem list in the area. That 14 percent finding is far above the one percent of Americans generally who mention the issue, according to the national PCCJ survey. This finding is not just a product of the urban nature of the Bay area. For example, only four percent of those in the Philadelphia PCCJ survey mentioned these issues as a top local concern. Only two percent did so in the Denver survey and less than one-half of one percent in the Tampa poll.
The mentions of poverty, hunger and homelessness are come in an unusual pattern, with both the young and the old and those in the city and in the suburbs more likely to name it as an issue.
- Older residents (those age 65 and older) and the youngest residents (those under 35) are the most likely to mention this issue (27 percent and 18 percent respectively.
- These issues are mentioned most often by those who say they live in a big city (20%), followed closely by those who say they live in the suburbs (15%). Only five percent of those who say they live in a small city or town mention it.
- African-American residents name these issues as the top problem 24 percent of the time. That finding is not significantly different from the level of concern voiced by other racial groups.
Detailed Findings: Crime and Safety
While other issues dominate the agenda, residents remain concerned about crime, violence and drugs. Asked about this issue in a specific question, 76 percent of the Bay area residents say it is at least a small problem, with 38 percent calling it a big problem in their community.
The concern about crime is real, but San Francisco residents feel safe at home and in other familiar locales. Ninety-four percent say they feel very safe or somewhat safe at home at night. Seventy-three percent say they feel equally safe walking around their neighborhood at night. Despite recent tragedies at schools, 66 percent say that they feel they and their families are safe at school. And 69 percent say they feel safe at shopping malls at night.
|
|
Very safe |
Somewhat Safe |
Not Too safe |
Not at All Safe |
Does Not Apply |
Don’t Know |
|
Safe at home |
67% |
27% |
5% |
1% |
0% |
0% |
|
Safe in neighborhood |
39% |
34% |
12% |
8% |
6% |
1% |
|
Safe at school |
28% |
38% |
12% |
5% |
16% |
1% |
|
Safe at shopping mall |
25% |
44% |
13% |
7% |
10% |
1% |
Across these four situations, the patterns by demographic group are complex.
Looking at people in their homes at night, the differences occur among the levels of those who say they feel very safe:
- The variations by race are complex and subject to more uncertainty because of the smaller number of interviews with each group. In terms of overall safety, 96 percent of white residents but only 86 percent of Hispanic residents say they feel very safe.
- A total of 78 percent of suburbanites say they feel verysafe, compared to 62 percent of those in a big city and 61 percent of those in small cities and towns.
- Seventy-seven percent of those with incomes at least $60,000 say they feel very safe contrasted with 60 percent of those making less per year.
- There are no differences in the perception of safety at home between men and women. This makes San Francisco the only location in the four city surveys where men are not more likely to say they feel very safe than women are.
When people talk about walking around their neighborhoods at night, the different perceptions among groups occur both among those who say they feel very safe and in overall feelings of safety:
- Men are more likely than women to feel very safe in their neighborhoods at night (46% vs. 32%).
- The variations by race are again not simple. For example, 42 percent of white residents but only 23 percent of African-American residents say they feel very safe. In terms of overall safety, 81 percent of the Asian-American residents say they feel safe, compared with 63 percent of the Hispanic residents.
- A total of 50 percent of suburbanites say they feel verysafe, compared to 31 percent of those in the big city and 35 percent of those in small cities and towns.
- Fifty-two percent of those with incomes at least $60,000 say they feel very safe contrasted with only 18 percent of those making less than $20,000 a year.
Going to shopping malls at night is a situation with similar patterns by demographic group.
- About four in five men (77%) say they feel safe at the malls, while only 62 percent of women would agree.
- And 81 percent of those with incomes of $60,000 and over say they feel at least somewhat safe at the mall, in contrast to 58 percent of those with incomes under $20,000.
- Four out of five suburbanites (80%) say they feel safe, compared to 66 percent of those in the big city and 65 percent of those in small cities and towns.
Despite a number of shootings at schools nationally that have attracted major attention in the past few years, the schools in San Francisco are still viewed as safe from crime, particularly by those most likely to be in a position to judge: the parents.
- Parents with children under age 18 at home are more likely than those without kids at home to view schools as safe (79% vs. 60%).
- Judgments that the schools are safe are about equal across racial groups. There is a suggestion from the data that African-American residents are more likely to say the schools are at least somewhat unsafe (39%) than other groups.
- Suburbanites are more likely than their big city counterparts to feel that schools are safe (73% vs. 56%).
The San Francisco Bay area is one of the most racially diverse in the country, but most residents do not see tension between racial and ethnic groups as a big problem in their community, with only 15 percent stating this view. Overall the public is split, with 56 percent saying racial tension is at least a small problem and 42 percent saying it is not a local problem. There are no significant differences between white, Asian-American, African-American and Hispanic residents in terms of their perception of the level of this problem in the community.
This view is tempered by two other findings.
First, San Francisco residents overall are split about whether recent immigrants from other countries have caused more problems in the United States than they have contributed to the country. This unhappiness with immigrants could fuel future tension over the role for immigrants in the community.
Second, there is a substantial split between the views of white residents and those of some minority residents on whether local institutions treat minorities fairly. For example, half of white residents say the police treat everyone equally, while only a third of the African-American and Hispanic residents agree.
Immigration
The impact of immigrants on America and on the San Francisco area in particular has been enormous. And the country has seen a very diverse group of immigrants to the country over the last 20 years.
San Francisco residents are split concerning the impact of recent immigrants on the United States as a whole. Thirty-five percent of the public says that immigrants have been a big problem or a small problem for the country, with 19 percent saying they have created big problems and 16 percent saying they have created small problems. Thirty-two percent say that immigrants have done more to improve the country than to cause problems. And about a quarter (24%) say that immigrants have not had much effect.
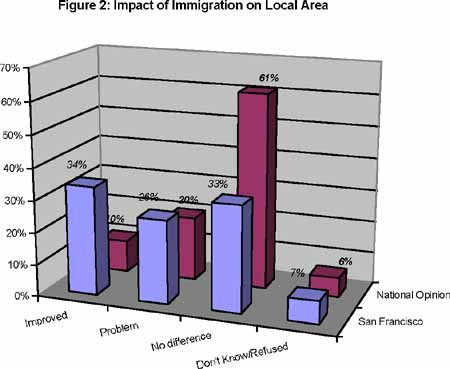
The San Francisco public’s views are less harsh when the focus is moved from the country as a whole to their own community. Thirty-three percent of the public say that recent immigrants have not had much impact on their community. Twenty-six percent say that immigrants have caused problems in their community, with 15 percent say they have caused big problems and 11 percent saying they have caused small ones. But 34 percent of the public say that recent immigrants have improved their local community.
San Francisco residents are more likely than all Americans to say recent immigrants have done more to improve their local area (34% vs. 13%). (See Figure 2.) But they are also more likely to say that recent immigrants have created at least small problems (26% vs. 20%). The net effect of these two differences is that San Francisco residents are much less likely than all Americans to say that immigrants have not made any difference (33% vs. 61%).
The figures from the national PCCJ survey actually reflect a slight improvement in the past few years. A survey in 1997 for the Knight-Ridder newspapers found that 50 percent of Americans said that recent immigrants created problems for the country, with 33 percent saying they had created big problems (A telephone survey for Knight-Ridder Newspapers by Princeton Survey Research Associates, based on interviews with 1,314 adults, age 18 years and older, May 2-26, 1997). The same number in each survey (16%) say that immigrants have improved the nation, while fewer in the survey in 1997 say that they have had no impact (27%).
Differing Perspectives
There is a long history of research documenting the differences between the views of white and minority Americans and this survey continues to show those disparities. The national PCCJ survey shows white Americans are more likely to have a positive opinion of their community than African-Americans. Nationally and in San Francisco, African-Americans are more likely to identify crime as an issue and less likely to mention growth and sprawl as problems.
The survey includes a series of four questions designed to elicit judgments on whether key local institutions treat everyone in San Francisco fairly or not. In three cases out of four, the majority opinion for each institution is that the institution is fair. And without exception, a majority of African-American residents disagree with the perception of fairness. With only one exception, the Hispanic residents also disagree that the institutions are fair. In contrast, Asian-Americans see all the institutions as fair. (See Table 4.)
|
|
Total |
White |
Asian-Americans |
African-Americans |
Hispanics |
|
An equal chance for a good education in public schools |
64% |
69% |
71% |
33% |
61% |
|
Local government treats everyone the same |
59% |
68% |
63% |
29% |
43% |
|
News media treats everyone the same |
59% |
66% |
56% |
24% |
47% |
|
Police treat everyone the same |
47% |
50% |
56% |
35% |
36% |
In addition, attitudes in the Bay area are more critical of the police and local government than elsewhere. The judgments that the police are fair and that the local government is fair are the lowest in any of the cities surveyed. About two-thirds of San Francisco residents (64%) say “All the students have an equal chance to get a good education in our local public schools, regardless of race.” Only 27 percent agree that “students who are black, Hispanic or other minorities do not have as good a chance to get a good education in the local public schools.”
- White residents see the schools as fair by a 69 percent to 23 percent margin. African-American residents strongly disagree, with only 33 percent seeing equal educational opportunity and 62 percent seeing a lack of equality.
In terms of the local government, most (59%) agree that “the local government treats everyone the same, regardless of race,” with only 27 percent taking the opposing view that “the local government unfairly treats blacks, Hispanics and other minorities more harshly than others.”
- Most white residents say the local government is even-handed, by a 68 percent to 19 percent edge, with Asian-Americans taking roughly the same view. But African-American residents disagree strongly, with only 29 percent seeing the local government as fair and 59 percent saying that it is not fair. Hispanics split: 43 percent see the media as fair and 45 percent as unfair.
- Men are more likely to say the government is fair than women (65% vs. 54%).
Dealings with the local police are often a sore point with minorities and these results suggest this is true in San Francisco. While the public overall says the police are fair by a 47 percent to 40 percent edge, that is most definitely not the view in the minority community.
- White residents say the police are even-handed by a 50 percent to 35 percent margin. African-American residents take the opposite view, with only 35 percent saying the police treat minorities fairly and 59 percent disagreeing. Hispanics take a similar view: 36 percent saying the police are fair and 56 percent unfair. Asian-American residents express views similar to those of white residents, with 56 percent saying the police are fair.
![]()
“There is biased reporting on minorities who are unfairly portrayed in media.”
— One view from San Francisco
![]()
The local news media is also viewed as fair by the San Francisco public generally, but as unfair in the African-American community in San Francisco (as it is nationally). Nearly three in five residents (59%) agree that “the news media treats everyone the same, regardless of race.” Just under a third (32%) say that “the news media unfairly runs too many negative stories about blacks, Hispanics and other minorities.”
- In contrast, African-American residents definitely say the news media are unfair by a 73 percent to 24 percent margin. White residents reject the criticism by 66 percent to 23 percent. Again, Hispanics are split: 47 percent see the media as fair and 45 percent as unfair. And again, Asian-American residents express views closer to those of white residents, with 56 saying the news media are fair and 33 percent saying unfair.
Neighborhood Diversity
When San Francisco residents walk their neighborhood streets, they say they see diversity. Sixty-four percent say that there is a mixture of racial groups in their neighborhood. Seventeen percent report that most of the people in their neighborhood are of their race and seven percent of the public say that everyone in their neighborhood is the same race as they are.
Despite these reports of substantial diversity in the neighborhoods, most San Francisco residents say that when they talk with those of different races it is outside of the neighborhood. Forty-two percent say that they most often talk to those of other races at work. Seventeen percent say those conversations most often occur in stores and shops. Only 15 percent say they most often talk with others of different races in their neighborhoods and nine percent say at school. Three percent report the conversations at church and 12 percent at some other place.
Report continued in San Francisco Part Two…
[Table of Contents] [National Report] [Tampa Report] [Philadelphia Report]
[Denver Report] [San Francisco Report] [Topline Results] [Press Release]