
Research – Straight Talk From Americans – 2000
A Survey for the Pew Center for Civic Journalism
Conducted By Princeton Survey Research Associates
The Philadelphia Area: Part One
CONTENTS
Highlights
This Survey
The State of The Community
Top Local Problems
Table 1: Most Important Local Issue
Detailed Findings: Crime and Safety
Table 2: Feeling Safe
Detailed Findings: Growth, Traffic and Sprawl
The Daily Grind
Detailed Findings: Race
Same Institutions: Different Perspectives
Table 3: Agree That Institutions Are Fair
Neighborhood Diversity
Immigration
[To Philadelphia Part Two >>]
Philadelphia area residents enter the new century worried about their community and their nation, seeing major problems such as crime and sprawl. They are deeply divided about the state of the community and its problems when one looks at their views by race, income and education.
The biggest local problem in the eyes of Philadelphia residents is crime and violence, with more than one in four (29%) naming it as the top local issue. And they also name crime and violence as the No. 1 issue facing the country.
Residents name the problems associated with growth, development, sprawl and traffic second on their list of local issues. About one in five (18%) mention concerns ranging from traffic congestion to worries about too many new homes. Third on the list of major local problems is education, with Philadelphia residents seeing big changes that need to be made.
The poll highlights a number of additional areas where Philadelphia residents are concerned and often divided about problems and solutions.
- White residents and minority residents have sharply different views on whether local institutions treat minorities fairly. For example, 60 percent of white residents say the police treat everyone equally, while 58 percent of African-American residents disagree.
- Residents are more likely to say that recent immigrants from other countries caused problems in the United States than they are to say the immigrants have made contributions. Thirty-six percent say that recent immigrants have been a source of problems.
- Philadelphia residents see problems in their local public schools and changes that need to be made. A majority (55%) say the quality of the education offered in the local public schools is a small problem. There are sharp differences in the perceptions of the quality of public schools, with those in the city far more concerned than those in the suburbs.
- While most residents express satisfaction with how much time they spend in every day tasks, parents with children at home and those from households where both the husband and wife work are less satisfied with their leisure time. (See Detailed Findings: Personal Life)
This Survey
This survey is one of five designed to provide journalists a clear look at where the nation and its communities stand at the start of a new century. This survey of the Philadelphia area – accompanied by a national poll and surveys in Tampa, Denver and San Francisco – serves as a guide to areas worthy of further investigation and reporting and as a context for that investigation and reporting. In addition to the broad look at the state of the nation and the communities, the survey takes a closer look at public opinion in three specific problem areas: growth and sprawl, race, and education. These areas were identified by PCCJ as of particular importance in shaping the journalism of the years ahead.
This poll for the Pew Center for Civic Journalism offered Philadelphia area residents the opportunity to list the issues most important to them, both at the national and local levels. A series of open-ended questions elicited free-form responses from the public about what is on their minds at the end of the decade. This approach allowed citizens to express their views without the filter of defining the problems to be discussed. After these free-form questions, more specific questions were included to focus on specific issues.
These are among the findings of a new survey in the Philadelphia area about the state of the country and our local communities at the end of the 1990s. This survey of adults aged 18 and older in the Philadelphia area was conducted on behalf of the Pew Center for Civic Journalism, an initiative of the Pew Charitable Trusts. This survey covered residents in Philadelphia, Bucks, Chester, Delaware and Montgomery counties in the Philadelphia area. All the findings of the survey refer to that five-county area. A representative sample of 501 adults was interviewed by telephone during the period November 10 through November 27, 1999. For results based on the total sample, one can say with 95 percent confidence that the error attributable to sampling is plus or minus five percentage points. Results based on smaller subgroups are subject to a larger margin of sampling error. In addition to sampling error, the practical difficulties of conducting telephone surveys can introduce error or bias into their results.
Philadelphia area residents are divided in their opinions about their community, making them less enthusiastic about the city and its environs than most Americans are about their own communities. And there are further divisions among various groups in judgments about the area.
Just over half of area residents (53%) say they are satisfied with “the way things are going in the Philadelphia area.” Thirty-eight percent are dissatisfied and nine percent are not sure. These numbers are well below those from the national PCCJ survey. Nationally, 84 percent say they are satisfied with “the way things are going in your community.” Only 22 percent are dissatisfied.
Asked to use another yardstick, three in five residents (60%) rate the Philadelphia area positively as a place to live (The survey is based on telephone interviews with residents of Philadelphia, Bucks, Chester, Delaware and Montgomery counties in the Philadelphia area. All references to Philadelphia, the Philadelphia area and the like refer to the multi-county area). That includes 14 percent who rate it excellent and 46 percent who rate it as good. Thirty-eight percent rated the are negatively, with 27 percent saying it is only fair and 11 percent rating it as poor. One percent do not answer. Again, these numbers are positive, but less so than the national figures. Nationally, 73 percent of the public give their communities positive ratings (compared with 60 percent for Philadelphia) and 16 percent negative ratings.
Within the overall numbers on satisfaction, those with lower incomes, less education and African-American residents are less pleased with the community.
- Those with incomes of $60,000 a year or more rate their communities most highly, with 71 percent saying they are satisfied. Only 35 percent of those who make less than $20,000 say they are satisfied. (Differences in survey findings are noted in this report only if they meet the criterion of statistical significance at the (95%) level of confidence.)
- Among those who have at least attended college, 61 percent say they are satisfied with the local area, compared with only 45 percent of those who have not been to college.
- Among white residents, 59 percent say they are satisfied, with 31 percent dissatisfied. The numbers reverse for African-American residents, with only 38 percent satisfied and 59 percent dissatisfied. Hispanic residents appear to hold opinions similar to the African-American residents, but the number of interviews is too small to reach a conclusion. (Where differences in the survey findings do not reach the 95% confidence level, but other evidence (such as other surveys) suggest that these weaker comparisons could be interesting, the findings may be mentioned as suggestive of further investigation.)
Top Local Problems
![]()
“The crime from kids from 16 to 19 year olds: they don’t have much to do. All they have is crime and gangs, no kind of leadership.”
— Words from one Philadelphia resident
![]()
Philadelphia residents put crime and violence at the top of the list, with nearly a third of residents (29%) naming it the most important problem facing Philadelphia today. Not only does it top the list, crime and violence are named as the top local problem more in Philadelphia than is the case nationally (18%). (See Table 1.)
|
Now, what do you think is the most important problem facing the Philadelphia area? |
Philadelphia |
Nation |
||||||
|
Crime/violence |
29% |
18% |
||||||
|
Development/Sprawl/Traffic/Roads |
18% |
18% |
||||||
|
Education |
12% |
10% |
||||||
|
Economic issues/The economy |
11% |
13% |
||||||
|
Problems with Politics/Politicians |
5% |
3% |
||||||
|
Child and teen issues |
4% |
6% |
||||||
|
Poverty/Hunger/Homelessness |
4% |
1% |
||||||
|
Moral decline/Decline of Family Values |
2% |
3% |
||||||
|
Racism/Discrimination/Intolerance |
2% |
2% |
||||||
|
Things are good here |
1% |
3% |
||||||
|
Health/medicine |
1% |
1% |
||||||
|
The Environment |
0% |
2% |
||||||
|
Problems with Immigrants |
0% |
2% |
||||||
|
Natural disasters/Hurricanes/Floods |
0% |
1% |
||||||
|
Law enforcement/Justice/Court system |
* |
2% |
||||||
|
Senior citizen issues/Care of the elderly |
* |
1% |
||||||
|
Everything/So many things |
1% |
0% |
||||||
|
Other |
3% |
4% |
||||||
|
New to the area/Just moved here |
* |
1% |
||||||
|
Nothing/no problems/None |
1% |
6% |
||||||
|
Don’t know/Can’t think of anything |
7% |
5% |
||||||
|
Refused/No comment |
1% |
1% |
||||||
Note: An asterisk (*) means less than .5 percent gave this answer.
Crime is a major issue for all demographic groups, with the problem always ranking as the top or the second most important issue. Within that consensus, there are often strikingly different levels of concern. Crime is more often cited as a problem by young people, those living in the city, low- and middle-income households and African-American residents.
- African-American residents name crime the top issue 42 percent of the time, compared to 24 percent for white residents.
- About 40 percent of those under age 35 say crime is the top local problem, while only 24 percent age 35 and over mention it.
- Among those who say they live in the city, crime is the top problem for 34 percent, while 20 percent of those who say they live in the suburbs make it the top problem.
- Growth and sprawl tops crime as the major local problem in the suburbs. Twenty-four percent of those who say they live in the suburbs rated growth and sprawl issues as the most important local problems, compared with 13 percent of those who say they live in the city.
- Among those who make less than $40,000 a year, 35 percent mention crime as a top issue, compared with 21 percent of those who make $40,000 a year and more.
- Those who have not been to college mention crime as the top issue 34 percent of the time, compared to 23 percent of those who have gone to college.
Detailed Findings: Crime and Safety
Crime is a major issue for all demographic groups, with the problem always ranking as the top or the second-ranking issue when the public is asked to volunteer a concern.
In addition to the open-ended question, Philadelphia residents were also asked in a separate question whether crime, violence and drugs are a problem in the area. Seventy-three percent say it is at least a small problem, with 35 percent calling it a big problem in their community. Only 27 percent say it is not a problem.
The concern about crime is real, but Philadelphia residents express a substantial feeling of safety in common situations. Again, there are substantial differences in the level of this feeling of safety for various groups.
Ninety-five percent of residents say they feel very safe or somewhat safe at home at night. Eighty-six percent say they feel equally safe walking around their neighborhood at night. Despite recent tragedies at schools, 65 percent say that they feel they and their families are safe at school. And 71 percent say they feel safe at the shopping malls at night.
|
|
Very safe |
Somewhat Safe |
Not Too safe |
Not at All Safe |
Does Not Apply |
Don’t Know |
|
Safe at home |
60% |
35% |
4% |
1% |
0% |
0% |
|
Safe in neighborhood |
37% |
39% |
11% |
7% |
6% |
* |
|
Safe at school |
30% |
35% |
13% |
4% |
16% |
1% |
|
Safe at shopping mall |
21% |
50% |
14% |
6% |
8% |
1% |
Across these four situations, there are broad patterns by demographic group. Generally speaking, men in the Philadelphia area feel safer in the situations than women; white residents feel safer than African-American residents; and higher-income people report feeling safer than those with lower incomes.
Looking at people in their homes at night, the differences occur among the levels of those who say they feel very safe:
- Men are more likely than women to feel very safe at home at night (65% vs. 55%).
- Nearly two-thirds of white residents (64%), but only 47 percent of African-American residents, say they feel very safe.
- A total of 70 percent of suburbanites say they feel very safe, compared to 46 percent of city dwellers.
- While only 52 percent of those with incomes under $40,000 a year feel very safe at home, 78 percent of those with incomes at least $60,000 say they feel that safe.
When people talk about walking around their neighborhoods at night, the differences among groups occur both among those who say they feel very safe and in overall feelings of safety:
- Men (47%) are more likely than women (27%) to feel very safe in their neighborhoods at night.
- About four in 10 white residents (43%), but only 16 percent of African-American residents, say they feel very safe.
- More than three in five of those with incomes of $60,000 and over (61%) feel very safe. Only 15 percent of those making under $20,000 say that.
- Half of the suburbanites (53%) feel very safe, as opposed to just 15 percent of city residents. (Overall, 87 percent of the suburbanites say they feel at least somewhat safe, while only 59 percent of the city residents do.)
Going to shopping malls at night is a situation in which residents are less likely to say they feel safe.
- About four in five men (82%) say they feel safe at the malls, while only 60 percent of the women would agree.
- More than a third of those with incomes of $60,000 and over (35%) feel very safe, compared to 12 percent of those with incomes under $20,000. (And 86 percent of those with the highest incomes say they feel at least somewhat safe at the mall, in contrast to 55 percent of those in the lowest income group.)
Despite a number of shootings at schools nationally that have attracted major attention in the past few years, the schools in Philadelphia are still viewed as safe from crime, particularly by those most likely to be in a position to judge: the parents.
- Parents with children under age 18 at home are far more likely than those without kids at home to view schools as safe (78% vs. 57%).
- More than two in five of those with incomes of $60,000 and over say the schools are very safe, compared to just over one in five of those with incomes under $20,000 (44% vs. 24%).
- Judgments that the schools are safe are about equal across racial groups. The variation that does occur is that African-American residents are more likely to say the schools are at least somewhat unsafe (28%), compared with 13 percent of white residents. White residents are more likely than African-American residents to say the question does not apply to them.
- Suburbanites are more likely than their city counterparts to feel that schools are safe. (67% vs. 52%).
Detailed Findings: Growth, Traffic and Sprawl
As a city that has been a major metropolitan area since Colonial times, the Philadelphia area has not seen the recent explosive growth that has marked other areas. But growth has increased the strain on roads, public transportation, schools and other government services, causing problems for Philadelphia residents.
Philadelphia residents say the No. 2 issue on the list of local problems is the complex of issues surrounding growth, development, traffic and roads. Eighteen percent of them mention this without prompting.
The issues related to sprawl were mentioned more often by those who live in the suburbs and by white residents.
- Twenty-four percent of those who say they live in the suburbs rated growth and sprawl issues as the most important local problems, compared with 13 percent of those who live in the city.
- And white residents are more likely to mention it than African-American residents (22% vs. 8%).
Asked directly about these issues in separate questions, it is clear that they loom large as local problems. Asked whether traffic congestion is a problem in the community where you live, more than two in five Philadelphia residents (44%) say it is a big problem. And 30 percent say it is a small problem. Only 25 percent say traffic congestion is not a problem.
There are some differences by demographic groups in this perception.
- Forty-eight percent of the white residents say that traffic congestion is a big problem, compared with only 31 percent of African-American residents.
- Those who live in the city are more likely to say the traffic is not a problem, with 31 percent taking that view, in contrast to only 18 percent of those in the suburbs who see no problem.
Likewise, “too much growth and development” are labeled as a big problem in the Philadelphia area by 34 percent of residents. Twenty-six percent say it is a small problem and 39 percent say it is not a problem.
- Forty-one percent of the white residents say that too much growth and development is a big problem, compared with only nine percent of African-American residents.
- Of those who live in the suburbs, 44 percent say too much growth and development is big problem, but only 17 percent of those in the city see it as such a major issue.
Where Philadelphians and the rest of the country part company is on the solution to the problems of growth, sprawl and traffic. As is true nationally, there is no consensus on what local government officials should do to handle these problems. But in Philadelphia, the majority comes down on the side of limiting growth. Fifty-one percent say that growth and development should be limited to areas that are already built up, implicitly protecting those areas that are not yet developed. Only 41 percent say that local government should allow growth and development to continue to occur in all areas. These are the mirror image of the national numbers, where Americans favor local government continuing to allow growth everywhere by a 52 percent to 40 percent margin.
The demographic splits on limiting growth are less dramatic than on other issues. The major divisions on this question come by race and location.
- White residents divide 54 percent to 37 percent in favorof limiting growth, while African-American residents divide 56 percent to 40 percent against such limits.
- And those living in the city favor widespread growth, while those living outside the city limits favor limiting growth to built-up areas.
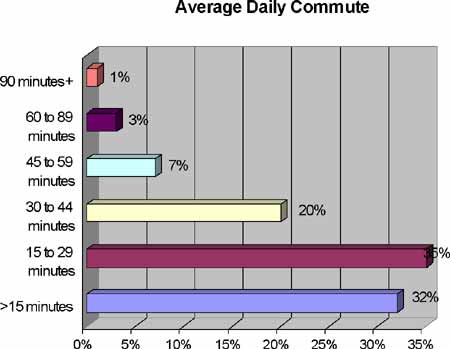
Traffic is perceived to be a problem in part because residents spend so much time in their cars. Nine out of ten Philadelphia area workers (90%) commute to their jobs on an average day, with 78 percent traveling in their cars. For just over a quarter of the workers (28%), the commute takes less than 15 minutes each way. About another third (31%), the daily commute lasts 15 minutes to just under half an hour. For 21 percent of the workers, the travel to work lasts half-an-hour to just under 45 minutes. And for 17 percent of the workers, the commute is 45 minutes or more each and every workday. These figures suggest that the average Philadelphia commute is slightly longer than the daily commute of all workers, given its comparison with the national PCCJ survey.
But public transit can be as slow as taking your car. Twenty-nine percent of those whose commute is an hour or longer use public transit, compared with only seven percent of those who say their commute is less than 30 minutes each way. Since seven out of ten of those who use public transit make less than $40,000 a year, the burden of a long, non-car commute falls more on the lower-income groups.
Those who say traffic congestion is at least a small problem were asked to pinpoint the cause. The answers reflect the lack of a consensus on the reasons, one stumbling block to solving the problem. Thirty-eight percent say the reason is simple population growth in the area. Twenty percent blame a lack of adequate planning. Fifteen percent say not enough money has been spent on highways and transportation and 20 percent say over-development. Six percent are not sure. These figures are close to the analysis that Americans nationally give of the reason for traffic congestion in their communities, although Philadelphia residents are slightly more likely to blame over-development.
Despite the differences in perceptions between white and African-American residents on many questions in the survey, the two groups are united in saying they do not see tension between racial and ethnic groups as a big problem in their community. Only 14 percent of all Philadelphia residents see tension between racial and ethnic groups as a big problem in their local community. In addition, 28 percent say that such tensions are a small problem. A majority (56%) say that racial tensions are not a problem in the community.
There are no significant differences between white residents (13 percent say big problem) and African-American residents (14 percent say big problem) in terms of their perception of the level of racial tensions as a problem in the community. (Hispanics may be more likely to see racial tensions as a big problem, but this is only suggested by the survey, given the small number of Hispanics interviewed.)
Same Institutions: Different Perspectives
That unity does not extend to judgments of key community institutions and how fairly they treat minority group members. There is a substantial split between the views of white residents and those of minority residents on whether local institutions treat minorities fairly.
Four questions elicited judgments on whether key local institutions treat everyone in Philadelphia fairly or not. Without exception, the majority opinion for each institution is that the institution is fair. And without exception, African-American residents are less likely to agree with the perception of fairness. (See Table 3.)
|
|
Total |
White |
African-Americans |
|
An equal chance for a good education in public schools |
75% |
82% |
53% |
|
Local government treats everyone the same |
66% |
75% |
34% |
|
News media treats everyone the same |
59% |
67% |
33% |
|
Police treat everyone the same |
55% |
60% |
39% |
Three-quarters of Philadelphia residents (75%) say “All the students have an equal chance to get a good education in our local public schools, regardless of race.” Only 20 percent agree that “students who are black, Hispanic or other minorities do not have as good a chance to get a good education in the local public schools.”
- White residents see the schools as fair by an 82 percent to 14 percent margin. African-American residents are substantially less likely to agree, with only 53 percent seeing equal educational opportunity and 43 percent seeing a lack of equality.
In terms of the local government, most (66%) agree that “the local government treats everyone the same, regardless of race”, with only 22 percent taking the opposing view that “the local government unfairly treats blacks, Hispanics and other minorities more harshly than others.”
- Most white residents say the local government is even-handed, by a 75 percent to 12 percent edge. But African-American residents disagree strongly, with only 34 percent seeing the local government as fair and 56 percent saying that it is not fair.
- Men are more likely to say the government is fair than women (73% vs. 60%).
Dealings with the local police are often a sore point with minorities and these results suggest this is true in Philadelphia. While the public overall says the police are fair by a 55 percent to 33 percent edge, that is most definitely not the view in the minority community.
- White residents say the police are even-handed by a 60 percent to 26 percent margin. African-American residents take the opposite view, with only 39 percent saying the police treat minorities fairly and 58 percent disagreeing.
The local news media is also viewed as fair by the Philadelphia public generally, but as unfair in the African-American community in Philadelphia (as it is nationally). Nearly three in five residents (59%) agree that “the news media treats everyone the same, regardless of race.” Just under a third (31%) say that “the news media unfairly runs too many negative stories about blacks, Hispanics and other minorities.”
- In contrast, African-American residents agree with the criticism of the news media by a 60 percent to 33 percent margin. White residents reject the criticism by 67 percent to 22 percent.
Neighborhood Diversity
The neighborhoods of the Philadelphia area vary widely in diversity, residents say. Eighteen percent of the public say that everyone in their neighborhood is the same race as they are. Thirty-five percent say that most of the people in their neighborhood are of their race, while five percent say that most of the people in their neighborhood are of another race. And 41 percent say there is a mixture of racial groups in their neighborhood.
Despite these reports of substantial diversity in the neighborhoods, most Philadelphia residents say that they talk with those of different races outside of the neighborhood. For example, 44 percent say that they most often talk to those of other races at work. Twenty percent say those conversations most often occur in stores and shops. Only 12 percent say they most often talk with others of different races in their neighborhoods and six percent say at school. Five percent report the conversations at church and 10 percent at some other place. These numbers are quite similar to the findings in the national PCCJ survey. White residents and African-American residents report roughly similar patterns of contact with those of other races.
Immigration
The impact of immigrants on America and on the Philadelphia area has been enormous over the years. And the country has seen a diverse group of immigrants to the country over the last 20 years.
On balance, Philadelphia residents see recent immigrants as more of a problem than a positive influence on the country as a whole. Thirty-six percent of the public says that immigrants have been a big problem or a small problem for the country, with 21 percent saying they have created big problems and 15 percent saying they have created small problems. Only 20 percent say that immigrants have done more to improve the country than to cause problems. And more than a third (36%) say that immigrants have not had much effect. These figures show Philadelphia residents are slightly more positive about recent immigrants than the opinions of all Americans as described in the national PCCJ survey.
The Philadelphia public is slightly less likely to say immigrants have caused problems in the local area. Forty-three percent of the public say that recent immigrants have not had much impact on their community. Twenty-nine percent say that immigrants have caused problems in their community, with 17 percent say they have caused big problems and 12 percent saying they have caused small ones. Only 17 percent of the public say that recent immigrants have improved their local community.
Philadelphia residents are slightly more likely that all Americans to say recent immigrants have done more to improve their local area (17% vs. 10%). But they are also more likely to say that recent immigrants have created at least small problems (29% vs. 20%). The net effect of these two differences is that Philadelphia residents are much less likely than all Americans to say that immigrants have not made any difference (43% vs. 61%).
The figures from the national PCCJ survey actually reflect a slight improvement in the past few years. A survey in 1997 for the Knight-Ridder newspapers found that 50 percent of Americans said that recent immigrants created problems for the country, with 33 percent saying they had created big problems (A telephone survey for Knight-Ridder Newspapers by Princeton Survey Research Associates, based on interviews with 1,314 adults, age 18 years and older, May 2-26, 1997). The same number in each survey (16%) say that immigrants have improved the nation, while fewer in the survey in 1997 say that they have had no impact (27%).
Report continued in Philadelphia Part Two…
[Table of Contents] [National Report] [Tampa Report] [Philadelphia Report]
[Denver Report] [San Francisco Report] [Topline Results] [Press Release]