
A National Survey for the Pew Center for Civic Journalism conducted by Princeton Survey Research Associates.
National Survey Results: Part One
CONTENTS
Highlights
This Survey
The State of Nation and Its Communities
Table 1: Most Important National Issue
The Local Community And Its Problems
Top Local Problems
Table 2: Most Important Local Issue
Top Local Problems: Crime and Safety
Table 3: Feeling Safe
Top Local Problems: Growth, Traffic and Sprawl
The Daily Grind
[To National Part Two >>]
As Americans enter a new century, they are evenly split over whether the nation is headed in the right direction, even as they are remarkably satisfied overall with daily life in their local communities. This satisfaction does not hide the problems the public sees around the nation and around their neighborhoods.
There are troubling divisions among Americans in perceptions of their own lives, the problems they see and their dealings with key institutions. Those with lower incomes and less education see more problems and are substantially less satisfied than those with higher incomes and more education. Members of America’s minorities feel less safe and have dramatically less faith in the fairness of the local government, police and news media.
Crime and violence and the decline of values are the top two national problems, even though no single issue dominates Americans’ concerns in this time of economic prosperity and relative peace around the world.
- From the national perspective, the public is worried about a broad sweep of moral issues. Crime and violence; a decline in the family; a lack of moral leadership; and similar concerns reverberate through the population. No issue was mentioned as the most important one facing the nation by more than 15 percent of the public, a finding far below those from similar surveys within the last six years.
- At the local level, Americans’ concerns are more related to their everyday lives. Crime is an issue — as are sprawl, traffic and over-development. Education and the need (even in a booming economy) to take care of everyone are also issues.
- About half of the public says that the quality of education in local public schools is a problem, and they see many changes needed to lift the quality of local schools.
- Americans are also divided about the impact of the recent waves of immigrants to this country. More than two in five say that recent immigrants have caused more problems for the nation than they have helped the country. The public is more positive about the impact of immigrants on their local community.
- While Americans are satisfied with their quality of life, parents with children at home and couples where both the husband and wife work outside the home are significantly less satisfied with the time they have for leisure activities.
- There are stark divisions between white Americans and minority Americans about whether key local institutions, such as the police and news media, treat minorities fairly. For example, 64 percent of white Americans say the police treat everyone fairly, while only 33 percent of African-Americans agree.
This Survey
This survey is one of five designed to provide journalists a clear look at where the nation and its communities stand at the start of a new century. The national survey is accompanied by four polls covering metropolitan areas around the country — Denver, Philadelphia, San Francisco and Tampa — to serve both as a guide to areas worthy of further investigation and reporting and as a context for that investigation and reporting. In addition to the broad look at the state of the nation and the communities, the survey takes a closer look at public opinion in three specific problem areas: growth and sprawl, race, and education. These areas were identified by PCCJ as of particular importance in shaping the journalism of the years ahead.
This poll for the Pew Center for Civic Journalism offered Americans the opportunity to list the issues most important to them, both at the national and local levels. A series of open-ended questions elicited free-form responses from the public about what is on their minds at the end of the decade. This approach allowed citizens to express their views without the filter of defining the problems to be discussed. After these free-form questions, more specific questions were included to focus on specific issues.
This national survey of adults aged 18 and older was conducted on behalf of the Pew Center for Civic Journalism, an initiative of the Pew Charitable Trusts. A representative sample of 1,004 adults was interviewed by telephone during the period October 6 through October 31, 1999. For results based on the total sample, one can say with 95 percent confidence that the error attributable to sampling is plus or minus three percentage points. Results based on smaller subgroups are subject to a larger margin of sampling error. In addition to sampling error, the practical difficulties of conducting telephone surveys can introduce error or bias into their results.
The State of Nation and Its Communities
Americans are worried about the direction of the nation and are split in terms of overall satisfaction with the state of the union. Forty-eight percent say they are satisfied with “the way things are going in this country today”, while 44 percent say they are dissatisfied (Differences in survey findings are noted in this report only if they meet the criterion of statistical significance at the 95% level of confidence.) Eight percent do not know or refuse to answer. These numbers represent a marked improvement over only five years. In a March 1994 survey for the Times-Mirror Center, only 24 percent of Americans were satisfied with the direction of the country and 71 percent were dissatisfied. (A telephone survey for the Times-Mirror Center for the People and The Press, based on interviews with 2,001 adults, conducted March 16-21, 1994, under the supervision of Princeton Survey Research Associates.)
This overall sense of satisfaction is tempered by differences of perception by gender, age, education and income.
- Fifty-three percent of men express satisfaction with the state of the union, but only 43 percent of women do so.
- Satisfaction declines with age. A majority of those under age 35 (54%) are satisfied with the direction of the nation, compared with only 34 percent of those age 65 and older.
- College graduates (56%) are more likely than high school graduates (46%) or those who had not completed high school (33%) to be satisfied.
- Satisfaction also rises with income — from a low of 35 percent among those making less than $20,000 to a high of 65 percent among those making $60,000 or more.
- Only those who live in rural areas express substantially different views of the state of the nation: 59 percent of rural residents say they are dissatisfied with the direction of the country.
- Views of the state of the union do not vary by race, with white Americans, African-Americans and Hispanics stating roughly similar views.
This poll for the Pew Center for Civic Journalism offered Americans the opportunity to list the issues most important to them, both at the national and local levels. A series of open-ended questions elicited free-form responses from the public about what is on their minds at the end of the decade.
From the national perspective, the public is worried about moral issues, construed with a broad brush. Crime, a decline in the family, a lack of moral leadership and similar concerns reverberate through the population.
One top issue mentioned by the public clusters around the topic of crime, violence and illegal drugs. These issues are named by 15 percent of the public. (This number is down substantially from the 32 percent who named this cluster of issues as the most important issue in a 1994 survey.) (A telephone survey for the Times-Mirror Center for the People and The Press, based on interviews with 2,001 adults, conducted March 16-21, 1994, under the supervision of Princeton Survey Research Associates.)
Generalized comments about a moral decline in the nation, a lack of values, a failure to embrace religious values are mentioned by 14 percent of the public. A significant subset of these concerns focuses on the moral decline of the family and the failure of the family structure. This category of moral concerns is up from 10 percent in the 1994 survey.
![]()
“Nobody puts any value on morals anymore. The country has moved away from our basic family values.”
— One person’s words
![]()
Issues involving children and teenagers are named by eight percent, with a heavy concentration in those comments on issues of morality, a lack of respect and out-of-control behavior by those who are not yet adults.
Another eight percent mention problems with politics and politicians. This cluster of issues also has a moral tone: a lack of national leadership and the failure of politicians to set a moral example. Five percent mentioned this in 1994.
With the economy booming along with low unemployment and low inflation, matters relating to money are mentioned by about 10 percent of the public. These comments range from calls for lower taxes, to a focus on the unemployed, and to those who say that prices are rising and everything still costs too much.
Education is also high on the list of problems, with eight percent of the public mentioning education. Eight percent also mention other issues related to children and teenagers.
No issue is mentioned as the most important one facing the nation by more than 15 percent of the public. The issues that are mentioned range widely, from the economy to poverty to foreign policy. (See Table 1.)
|
Now, what do you think is the most important problem facing the country today? |
|
|
Crime/violence |
15% |
|
Moral decline/Decline of Family Values |
14% |
|
Economic issues/The economy |
10% |
|
Education |
8% |
|
Child and teen issues |
8% |
|
Problems with Politics/Politicians |
8% |
|
Poverty/Hunger/Homelessness |
4% |
|
Health/Medicine |
4% |
|
Racism/Discrimination/Intolerance |
3% |
|
Foreign policy/Foreign relations |
3% |
|
Law enforcement/Justice/Court system |
2% |
|
Senior citizen issues/Care of the elderly |
1% |
|
Problems with Immigrants |
1% |
|
National security/Terrorism |
1% |
|
Welfare abuse/Fraud |
1% |
|
Sex/Violence in the media |
1% |
|
Abortion |
1% |
|
The Environment |
1% |
|
Everything/So many things |
1% |
|
Nothing/no problems/None |
1% |
|
Other |
5% |
|
Don’t know/Can’t think of anything |
6% |
|
Refused/No comment |
1% |
Looking at perceptions of national problems, there are some variations across demographic groups.
- Crime is a concern of all groups, but much more so among the minority communities. Only 13 percent of white Americans mention crime as the top issue, while 26 percent of the African-Americans and 30 percent of the Hispanics do so.
- Men are more likely than women to express concern about economic issues (13% vs. 7%), but men are less likely to mention issues related to children and teenagers (5% vs. 12%).
- Those who have at least attended college are more likely to mention moral issues than those who have not (18% vs. 11%). The reverse is true concerning crime, where those without college experience are more worried (18% vs. 12%).
- Those living in the suburbs are more worried about moral issues than those in the big cities (21% vs. 13%). Big city dwellers are more likely to mention the economy than suburbanites (11% vs. 5%).
The Local Community And Its Problems
Americans are far more satisfied with the way things are going in their local communities than they are with the state of the nation. Seventy-four percent of the public say they are satisfied with “the way things are going in your community.” Only 22 percent are dissatisfied with the direction of the local community and 4 percent are not sure. These numbers reflect a small change over the past five years: the 1994 Times-Mirror study said 68 percent were satisfied with their local community and 27 percent were dissatisfied. (The March 16-21, 1994, telephone survey for the Times-Mirror Center for the People and The Press.)
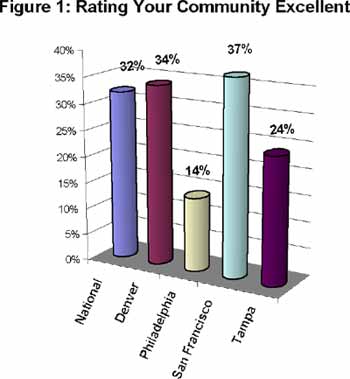
Looking at the communities with another yardstick, more than eight in ten Americans give excellent or good ratings to the area where they live. Nearly one-third (32%) rate their community excellent as a place to live. About half (51%) rate their local community as good. Just 13 percent rate their community as only fair and three percent rate it as poor.
Within these high levels of satisfaction, there are variations, particularly by race and by location.
- One’s rating of their community varies by where they live. Those who live in the suburbs really like it: 91 percent give the suburbs positive ratings, with 43 percent saying they are an excellent place to live. Those who live in the cities are pretty pleased as well, with 74 percent giving the city positive marks. But 26 percent of those in the cities give them negative ratings, compared to only 10 percent of those in the suburbs. Those who say they live in rural areas are happy as well: 87 percent say their community is a good or excellent place to live.
- On the other hand, African-Americans are much less likely to say they are satisfied. Only 52 percent of the African-Americans say they are satisfied with their community, compared to 77 percent for white Americans and 76 percent for Hispanics.
Looking at the question of rating the community on a scale of excellent to poor, additional variations appear.
- Those with incomes of $60,000 a year or more rate their communities most highly, with 43 percent giving excellent marks. Of those who make under $20,000 a year, only 23 percent rate their communities that highly.
- Only 15 percent of African-Americans give their community excellent marks, compared with 35 percent of white Americans. While African-Americans’ views of their communities are positive overall (62% positive vs. 38% negative), that is a much less optimistic view than held by white Americans (88% positive vs. 12% negative). Hispanics are in the middle (69% positive vs. 31% negative). Minority Americans also have less faith in the fairness of local institutions. (See Same Institutions: Different Perspectives)
- Younger Americans are less likely to give their communities an excellent rating than those age 35 and older (27% vs. 35%).
- And there are variations by city. (See Figure 1.) San Francisco (37%) and Denver (34%) have the greatest number of residents saying their area is an excellent place to live, far outstripping Tampa (24%) and Philadelphia (14%). (Each of the local surveys was conducted in multicounty area including the major city named. All local survey findings refer to those multicounty areas.)
Top Local Problems
![]()
“We’re growing faster than the facilities and things that were put here years ago are able to handle”.
— Words from 68-year-old woman
![]()
At the local level, Americans’ concerns are much more related to their everyday lives than is the case when discussing national issues. The complex of issues known as sprawl, growth, traffic, roads and infrastructure are a top concern, with 18 percent mentioning the issue. (See Table 2.) This cluster of issues is quite diverse, but all focus on the impact of growth and development on the daily lives of individuals. Whether it is traffic congestion, poorly-maintained roads, inadequate sewer and water or crowded schools, all the complaints focus on the quality of life that is endangered as the local infrastructure fails to keep pace with growth and development. (This complex of issues drew mentions from 13 percent of Americans in the 1994 poll.)
|
Now, what do you think is the most important problem facing the community where you live? |
|
|
Development/Sprawl/Traffic/Roads |
18% |
|
Crime/violence |
18% |
|
Economic issues/The economy |
13% |
|
Education |
10% |
|
Child and teen issues |
6% |
|
Problems with Politics/Politicians |
3% |
|
Racism/Discrimination/Intolerance |
2% |
|
Problems with Immigrants |
2% |
|
The Environment |
2% |
|
Law enforcement/Justice/Court system |
2% |
|
Moral decline/Decline of Family Values |
3% |
|
Health/medicine |
1% |
|
Poverty/Hunger/Homelessness |
1% |
|
Natural disasters/Hurricanes/Floods |
1% |
|
Senior citizen issues/Care of the elderly |
1% |
|
Other |
4% |
|
Things are good here |
3% |
|
New to the area/Just moved here |
1% |
|
Nothing/no problems/None |
6% |
|
Don’t know/Can’t think of anything |
5% |
|
Refused/No comment |
1% |
Sprawl is more of an issue for those in the suburbs than anywhere else, more of an issue for college-educated citizens and more of an issue among white Americans than African-Americans. And it is a huge issue in Denver and San Francisco.
- Twenty-six percent of those who live in the suburbs mention sprawl-related issues as the most important local matters, more than the 14 percent who do so in more rural areas.
- Twenty-four percent of those who have at least attended college mention it is an issue, compared with 13 percent of those who have not.
- And 20 percent of the white Americans say it is a top local issue, compared with eight percent of African-Americans.
- And there are enormous variations by city. In Denver, an astonishing 60 percent of residents name sprawl as the biggest problem facing the area. A strong 47 percent do so in San Francisco. Thirty-three percent mention it in Tampa and only 18 percent in Philadelphia. (Again, each of the local surveys was conducted in multicounty area including the major city named. All local survey findings refer to those multicounty areas.)
Crime and violence are just as important an issue at the local level as sprawl, with 18 percent mentioning it as well. Thus, crime is at the top of Americans’ list of big problems at both the national and local levels. (Crime and related issues were the top local problem mentioned by 29 percent in the 1994 poll.)
In terms of demographics, this complex of issues is almost the flip side of sprawl.
- More people mention it as a top issue in the city (30%) than in the suburbs (10%).
- Those making less than $20,000 a year name it as a top issue more often (25%) than those making $60,000 or more (11%).
- Those who have not been to college name it a top issue 22 percent of the time, compared with 13 percent of those who have been to college.
- As is true from the national level, crime is a local concern of all groups, but much more so among the minority communities. Only 15 percent of white Americans mention crime as the top local issue, while 35 percent of the African-Americans do so.
Concern about crime is highest among the youngest Americans. About one in four Americans under age 35 (24%) mention crime as a local problem, compared with only one in nine among those age 65 and over (11%).
Top Local Problems: Crime and Safety
Asked in a direct question about how big a problem crime, drugs and violence are in their communities, Americans put it at the top of the list of seven specific issues. Seventy-nine percent say crime, drugs and violence are a problem, with 32 percent calling them a big problem. Only 19 percent do not see these as a problem in their community.
Again, crime is a concern across all groups, but the intensity of the concern does vary.
- Just under half of African-Americans (48%) and Hispanics (46%) say crime is a big problem in their community. Just 29 percent of white Americans take that strong a view.
- Those who live in the cities are more likely than suburbanites (45% vs. 26%) to see crime as a bigproblem.
The concern about crime is real, but Americans still feel safe at home and in other familiar locales.
Ninety-six percent of those questioned say they feel very safe or somewhat safe at home at night. Eighty percent say they feel equally safe walking around their neighborhood at night. Despite recent tragedies at schools, 73 percent say that they feel they and their families are safe at school. And nearly as many, 70 percent, say they feel safe at the shopping malls at night. (These findings are quite similar to those from a 1993 poll, showing substantial feelings of safety in various situations. Telephone survey for Family Circle Family Index Project, based on 2,004 interviews of adult heads of households, June 1-June16, 1993 by Princeton Survey Research Associates.)
|
|
Very safe |
Somewhat Safe |
Not Too safe |
Not at All Safe |
Does Not Apply |
Don’t Know |
|
Safe at home |
67% |
29% |
2% |
1% |
0% |
1% |
|
Safe in neighborhood |
41% |
39% |
8% |
5% |
6% |
1% |
|
Safe at school |
35% |
38% |
8% |
3% |
16% |
1% |
|
Safe at shopping mall |
22% |
48% |
14% |
5% |
10% |
1% |
These high levels of feeling safe at home stretch across groups, but there are variations in the degree of safety that various demographic groups report.
- Seventy-one percent of white Americans report feeling very safe in their homes after dark. Only 45 percent of African-Americans report feeling that safe.
- Men are somewhat more likely than women to report feeling very safe (72% vs. 63%).
- Seventy-three percent of those with annual household incomes of at least $40,000 say they feel very safe at home compared to 61 percent of those who make less than $40,000.
- Those who live in the big cities are less likely to say they feel very safe (59%) than those living in smaller cities and towns (70%) and in rural areas (72%).
Similar patterns are apparent when people are asked about their sense of safety while walking in their neighborhoods after dark.
- White Americans (44%) are more likely than African-Americans (28%) to say they feel very safe on their evening walks.
- Men (47%) are more likely than women (36%) to report that high sense of safety.
- Only one in four big city residents reports feeling verysafe in their neighborhoods, compared with 45 percent of those who live elsewhere.
- Those age 65 and older are far less likely to feel safe walking about their neighborhoods. Only 58 percent report feeling safe at night, compared with 85 percent of those younger than 65.
Going to shopping malls at night may be a common experience for many Americans, but there are variations in the feelings of safety in such situations.
- Men are more likely than women to say they feel verysafe at the mall (30 percent vs. 16 percent).
- Again those age 65 and over are less likely to say they feel safe in the malls. But fully one-third say the question does not apply, suggesting they simply do not go to the malls at night.
At school, those with the most recent direct experience – parents of school age children and younger Americans – often feel safer than others.
- Forty-three percent of those under age 35 say they feel very safe at school, compared with only 24 percent of those age 65 and over.
- Eighty-four percent of parents say they feel safe at schools, compared with 65 percent of those without children under age 18 at home.
- Overall safety levels are similar across racial groups, African-Americans are the least likely to say they feel very safe at school (22 percent compared with 36 percent for white Americans.)
Top Local Problems: Growth, Traffic and Sprawl
Economic growth and development brings jobs, money and opportunity for a community and its residents. Such expansion has been a key feature of the American way of life since the colonists started moving inland from the Atlantic Coast more than 300 years ago. But growth and development have negative impacts as well and those problems are much on the minds of Americans.
Not only are these problems high on the list of the problems that the public talks about without prompting, these issues are labeled big problems across the nation in other ways. Asked whether traffic congestion is a problem “in the community where you live”, 35 percent of the public says it is a big problem. Almost as many, 30 percent, say it is a small problem. About a third (34%) say traffic congestion is not a problem where they live.
There are major variations by city on these questions. For example, 73 percent of Denver residents and 68 percent of San Francisco residents call traffic congestion a bigproblem, compared with 44 percent of Philadelphia residents.
The Daily Grind
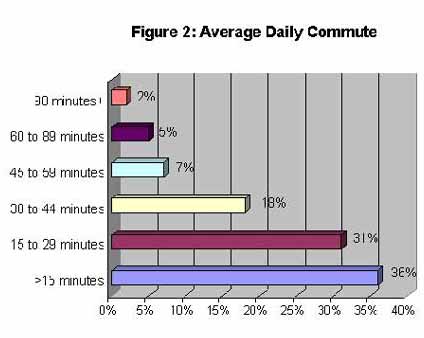
To anyone who has sat in rush hour traffic in Los Angeles or who has tried to take a bus across Peoria, Illinois, it should come as no surprise that Americans say they spend so much time in their cars. Nearly nine out of ten American workers (88%) commute to their jobs on an average day. Only five percent report taking public transportation to work. What may surprise some is that two-thirds of workers report their daily one-way commute is less than half an hour. For just over a third of the workers (36%), the commute takes less than 15 minutes. For another third (31%), the daily commute lasts 15 minutes to just under half an hour. But for 25 percent of the workers, travel to work lasts 30 minutes to just under an hour. And for seven percent of all workers, the commute is an hour or more each and every workday. (See Figure 2.)
The average commute is going up. A 1993 survey for Family Circle magazine found 42 percent saying the daily commute was less than 15 minutes; 31 percent saying 15 to 29 minutes; 20 percent saying a half an hour to 59 minutes and 5 percent reporting an hour or more each day. (Telephone survey for Family Circle Family Index Project, based on 2,004 interviews of adult heads of households, June 1-June16, 1993 by Princeton Survey Research Associates.)
And one would not be surprised to find out that the longer the commute, the more likely one is to say traffic congestion is a big problem. Among those who commute less than 30 minutes a day, 35 percent say that traffic congestion is a bigproblem. But among those whose commute lasts an hour or more each day (a small group nationally), 53 percent say it is a big problem.
As one would suspect, concern about traffic congestion is concentrated in the big cities and suburbs. Fifty-one percent of those living in big cities say traffic congestion is a bigproblem, and 46 percent of the suburbanites agree. Only 18 percent of those in rural areas report a big traffic problem.
Those who say traffic congestion is at least a small problem were asked to pinpoint the cause of the problem. The answers reflect the lack of a consensus on the reasons, one stumbling block to solving the problem. Forty-four percent say that the reason is simple population growth in the area. Twenty-one percent blame a lack of adequate planning. Fifteen percent say not enough money has been spent on highways and transportation and 13 percent say over-development. Six percent are not sure.
Looking at the cluster of issues from another angle, 28 percent of Americans say that too much growth and development is a big problem where they live. Twenty-seven percent say that it is a small problem. Forty-three percent say it is not a problem.
As one would suspect, the suburbs are the focus for this perception.
- Forty-one percent of those living the suburbs see too much growth and development as a big problem, compared with only 31 percent in the big cities and 21 percent in the rural areas.
- Those who have at least attended college are more likely to see it as a big problem than those who have not (32% vs. 24%).
- African-Americans are less likely to see growth and development as a problem (56 percent not a problem) compared with white Americans (42%) and Hispanics (33%).
- There are major variations by city on these questions. Sixty-five percent of Denver residents say too much growth and development are a big problem, contrasted with 40 percent in Tampa and 34 percent in Philadelphia.
The issues of growth and development are bedeviling local and state officials across the country, in large part because there is a substantial division over how to deal with the problems. This split is evident in the answers to a question how local government should use its power to focus growth. A bare majority of the public (52%) agree that “local government should continue to plan for and encourage growth and new development in all areas.” But a strong 40 percent agree that “local government should try to limit growth in less-developed areas and encourage growth only in areas that are already built up.”
Report continued in National Part Two…
[Table of Contents] [National Report] [Tampa Report] [Philadelphia Report]
[Denver Report] [San Francisco Report] [Topline Results] [Press Release]