
By Pat Ford
Pew Center Staff Writer
 At KQED.org, visitors can “plan” their own small city. At NYcitizens.org, they can “redraw” New York’s congressional districts. While at TBO.com, they can click on a Tampa map and call up the major crimes in a selected neighborhood.
These are just a few of the innovative ways that news organizations are using the Web’s interactive capabilities to move beyond simply providing information to engaging their audiences in actively analyzing and using information.
“This is great for citizen involvement and citizen understanding,” said Glenn Thomas, a founder of Smashing Ideas Inc. The Seattle firm designed a city planning game used by the Everett, WA, Herald’s Web site and another soon to debut on the Myrtle Beach Sun News site.
“You can say some of these things in a written article but they’re harder to understand. [Games] are a great way to get information to people in a way that helps them understand the impact of their choices,” he said.
Games are just one tool. News sites are starting to use clickable maps, calculators, dynamic databases and original documents to involve users more directly in stories. This is an emerging area for most news organizations – a decade ago, few even had Web sites – and there are technical and budgetary challenges. But editors and news directors see great potential for making their Web sites not just more interactive but also more fun.
“News doesn’t have to be boring even when it’s about serious stuff,” said Jon Greenberg, senior news editor at New Hampshire Public Radio (NHPR). “If you can help people begin to engage with a subject that they might be pretty nervous about, it can be very effective.”
 NHPR is one of the early innovators in linking the credibility of a news site with the kinds of interactivity previously the domain of advertising and entertainment sites. In 1998, as the New Hampshire legislature considered changing the state’s tax structure, NHPR developed a “Tax Calculator” that allowed users to plug in their personal income and real estate data and determine how different tax plans would affect them personally.
This proved to be such a popular feature that, a year later, when the state was deregulating electric utilities, NHPR put up another calculator to help users determine what was likely to happen to an individual’s energy bill.
“I definitely believe if you’re consistent and keep on doing things like this, that people get the idea that you’re a more interactive news organization and gradually they develop new habits,” Greenberg said.
Among the engaging applications to surface recently are games that allow users to become city planners. Borrowing from the popular computer game, Sim City, the Web sites let users choose development options and see the consequences of their choices.
In Everett and Myrtle Beach, the difference is that the Web sites use real places and actual data and readers get involved in real-world, public-policy decisions. Everett’s project is finished and the game is no longer active. The Herald recorded choices made by the 1,200 users who played the online game during the two-month period that it was up and made a report. Myrtle Beach expects to launch its game in mid-April.
 The development game designed by KQED, San Francisco’s public television station, is a little broader. It can be used by anyone, anytime, though it was aimed at complementing “Home Front,” a program on Bay Area gentrification.
The game gives players five different decisions to make about how to develop their city. At the end of the game, it explains the impact of each choice and it scores players on how well planned their cities are. See www.kqed.org.
“I think it’s what the Web was made for,” said KQED Web producer Sean Fagan. “People can go to TV and radio if they want information – that’s one way. If you’re making Web applications, it’s your duty to bring the user into the experience in some way. That does better than flat Web applications because people want to get engaged.”
The Wisconsin State Journal and its partners in the “We the People” civic journalism collaborative also wanted to engage people in a public-policy issue by letting them make decisions and see the impact. The big issue there was energy generation – a subject, concedes Associate Editor Tom Still, that most people found too complex or too dull.
“The whole discussion was taking place at 30,000 feet and they were at about 5,000,” Still said. “They were just not connected.”
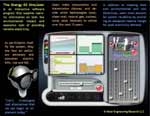 But the right technology, Still thought, could make people want to plug into the discussion. Working with the engineering department at the University of Wisconsin, the partners developed a game that lets users choose power plants fueled by coal, natural gas, hydroelectric, wind, solar or biomass energy. The game calculated the impact on electric bills and air pollution of each energy choice.
The partners did not put this on a Web site; instead they installed the software in computers used at a September conference attended by 250 people.
“It was wonderful,” said Paul Meier, a Wisconsin PhD candidate who designed the program and is now working on a way to get it on a Web site. “The [participants] were extremely grateful to have a way to discuss and participate in these decisions.”
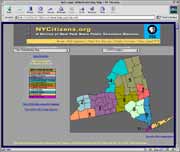
New York’s nine public television stations were facing a similar dilemma: how to engage the public in a discussion of vital public policy that seems too dull and too complicated for the average voter. In this case, at issue was redistricting Congressional seats to reflect new census data.
The stations created on NYcitizens.org a map that users can click on to look at census data and a game that allows them to use demographic data to try to build new districts to their liking – perhaps districts that will vote mostly Republican or likely to produce African-American representatives. The rule is that the districts cannot be gerrymandered but must be drawn in some kind of logical arrangement. The task is tricky enough to pull in people who like puzzles.
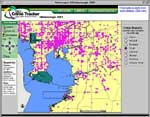 One of the most successful applications of clickable-map technology is the Crime Tracker on Tampa Bay Online (TBO). The TBO.com Web site works with both The Tampa Tribune and WFLA NewsChannel 8. TBO general manager Kirk Read said research showed that both readers and viewers wanted more information and more meaningful crime coverage, “so we put on our thinking caps and tried to come up with ways we could deliver on a customer need.”
They came up with a map of the area that links to crime statistics that are specific for the map area you click on. The site zooms in on your area of interest and shows, in color-coded dots, how various crimes – arson, robbery, drug dealing – occur through the area. You can also get the information by entering an address.
Usage rises and falls depending on how the feature is promoted. At its most active times, it get 30,000 visitors a day and each one stays for about seven minutes, checking out various neighborhoods.
“It’s about as relevant as you can get,” Read said. “You can pare the information down to something that affects you, and only you, which is [the safety of] your house.”
The Crime Tracker links off several different TBO.com pages, including the real estate page and the employment page so that people can use it to make a decision about buying a home or taking a job.
“This is something the community told us they needed to make more informed decisions and it has proven to be as useful or more so than we conceived,” Read said.
The Philadelphia Inquirer used a similar, yet simpler, tool in 2000, when it put nine years worth of crime data online as part of an investigative project on police manipulation of crime statistics. A key finding of the project was that police routinely downgraded rape cases to lesser crimes. By putting the police crime reports online, the paper allowed rape victims to search for their cases and see how the police logged them.
 The Inquirer continues to use interactive tools to support its investigative projects. For a recent series on the inequities of tax assessments in the Philadelphia area, the Web site provided a tax calculator, in which you could enter information about your house and its value and find out how much you would pay in taxes if the house were located in another jurisdiction.
The paper has also made a specialty of providing users with original documents it unearths in its investigations. In February, the Web site loaded hundreds of pages of documents reviewed for a series on how historic-preservation laws get abused at taxpayers’ expense.
“That’s the kind of cool thing you could never put in the paper because of the complexity of the documents and their length,” said reporter Craig McCoy. “It’s too dry for the vast majority of readers but, for a few, it’s really intriguing.”
Anthony Moor, new media editor of Rochester Democrat and Chronicle agrees that unmediated information, such as original documents, is a good way to engage news consumers. “It’s a ‘crane-the-neck’ thing; there’s a rubber-necking element to it,” he said.
 Moor has developed a number of features on the D and C’s Web site to engage readers more interactively, particularly in the site’s community profile section.
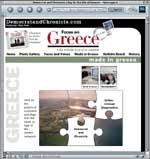
For example, in a profile of Greece, NY, visitors can play a matching game about the small town’s products and services and where they come from. Each correct answer forms part of a virtual jigsaw puzzle – a panoramic view of Greece that fills the screen when the puzzle is successfully completed.
“It brings you closer to the user when you’re interacting,” Moor said, “and in this day and age, everybody wants to be as close to the readers, users, customers as we can.”